
Hi! I'm Alice Costa!
I am a Data Analyst and student at Data Science Academy! I am particularly interested in the intersection between interpretability and Data visualization.
Projets Portfolio
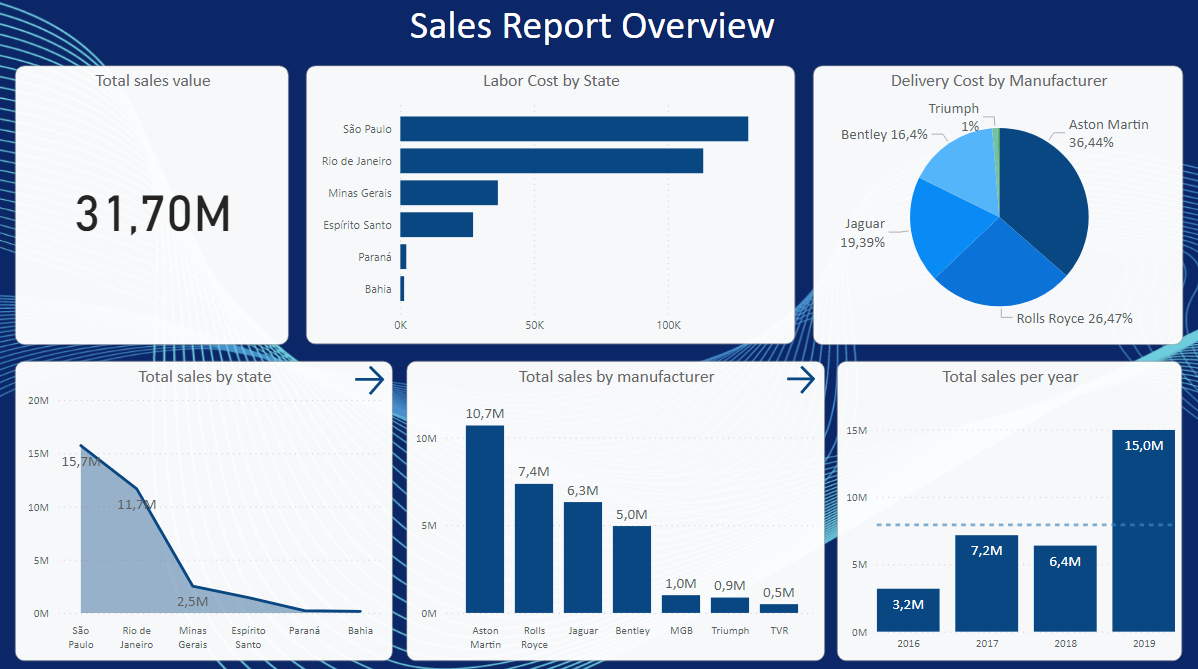
Sales Overview
The project aimed to answer the following questions: 1-Total Sales 2-Labor Cost By State 3-Delivery Cost by Manufacturer 4-Total sales by state 5-Total sales by manufacturer 6-Total sales per year 6-Sales average 7- Sales Matrix 8-Total sales by manufacturer and state 9-Total sales by manufacturer and year. Click on the dashboard and see details on Power BI Service tool!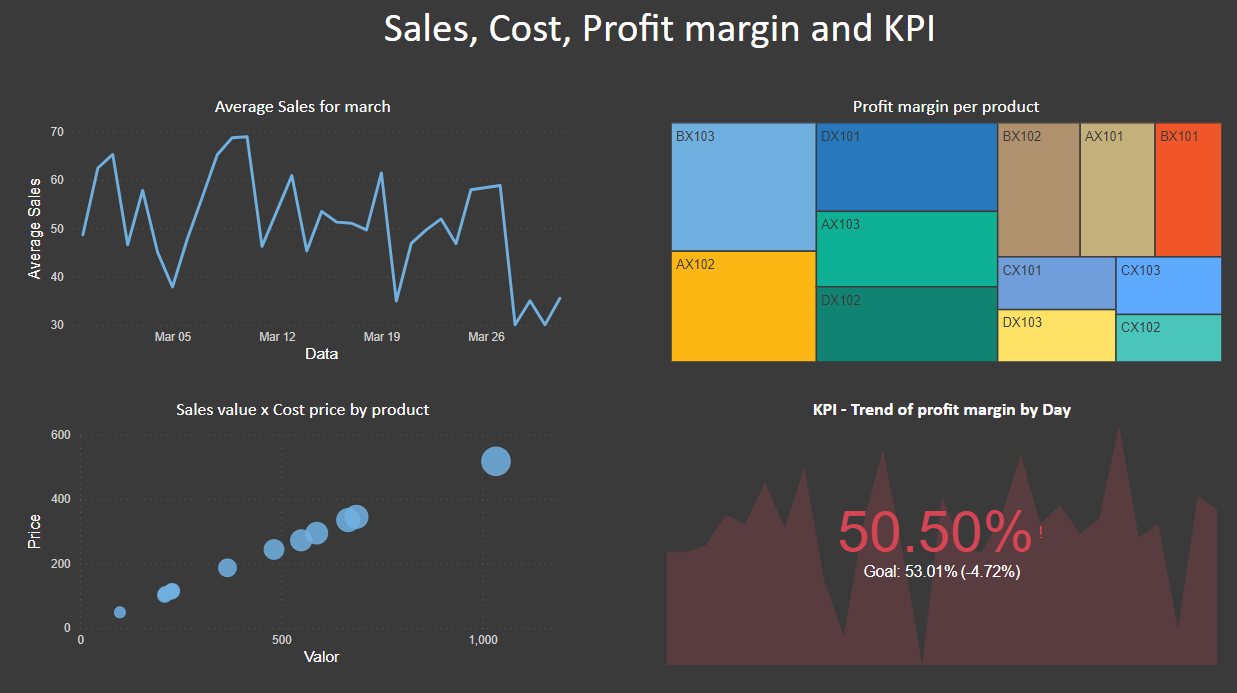
Sales Trend
Dashboard indicating average sales, cost per product, profit margin and kPI. Click on the dashboard and see details on Power BI Service tool!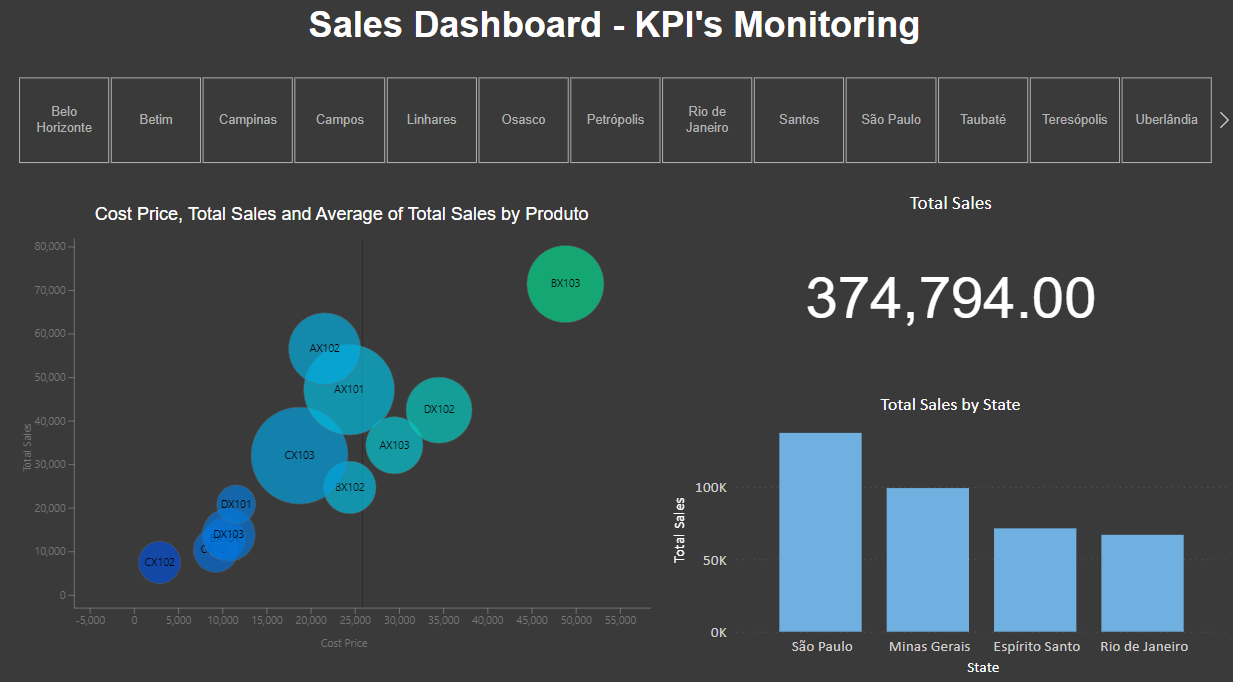
Sales KPI's Monitoring
Sales Key performance indicator by city. Click on the dashboard and see details on Power BI Service tool!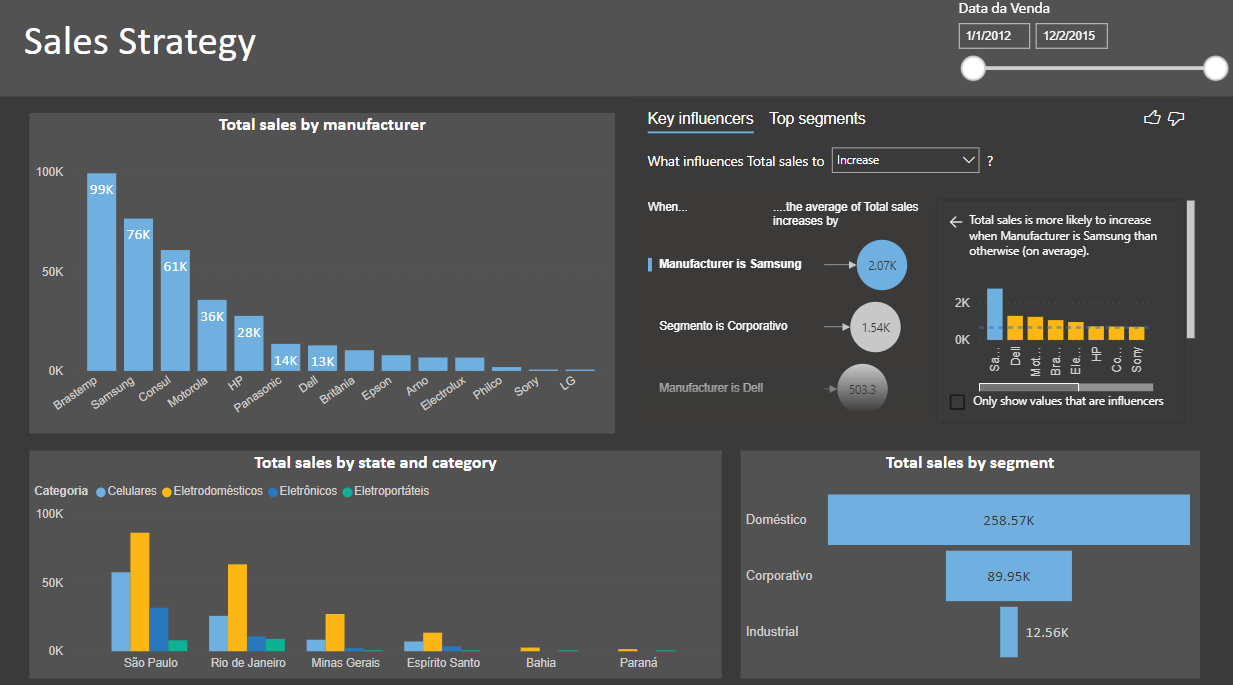
Sales Strategy
The objective is to discard manufacturers whose products have few sales and try to negotiate better conditions with the main manufacturers. In parallel with this, the company would like to have different views of sales made in the last 4 years (period from 2012 to 2015). Click on the dashboard and see details on Power BI Service tool!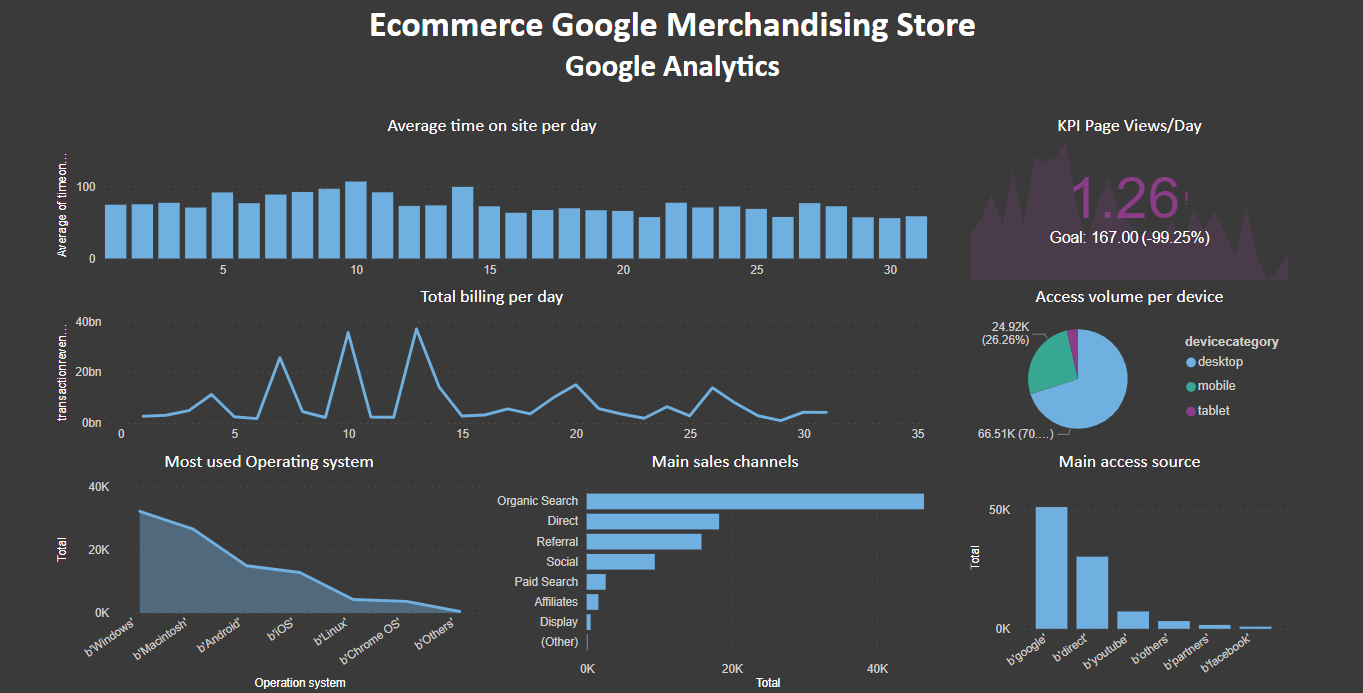
Ecommerce Google Merchandising Store
The project aimed to answer the following questions: How do customers access our portal the most, through organic search or pay? How long, on average, does a visitor stay on our portal per day of the month? What is the main source of access to our portal? What operating system is most used to access our portal? What device most used to access our portal? 6.What is the total billing per day? Click on the dashboard and see details on Power BI Service tool!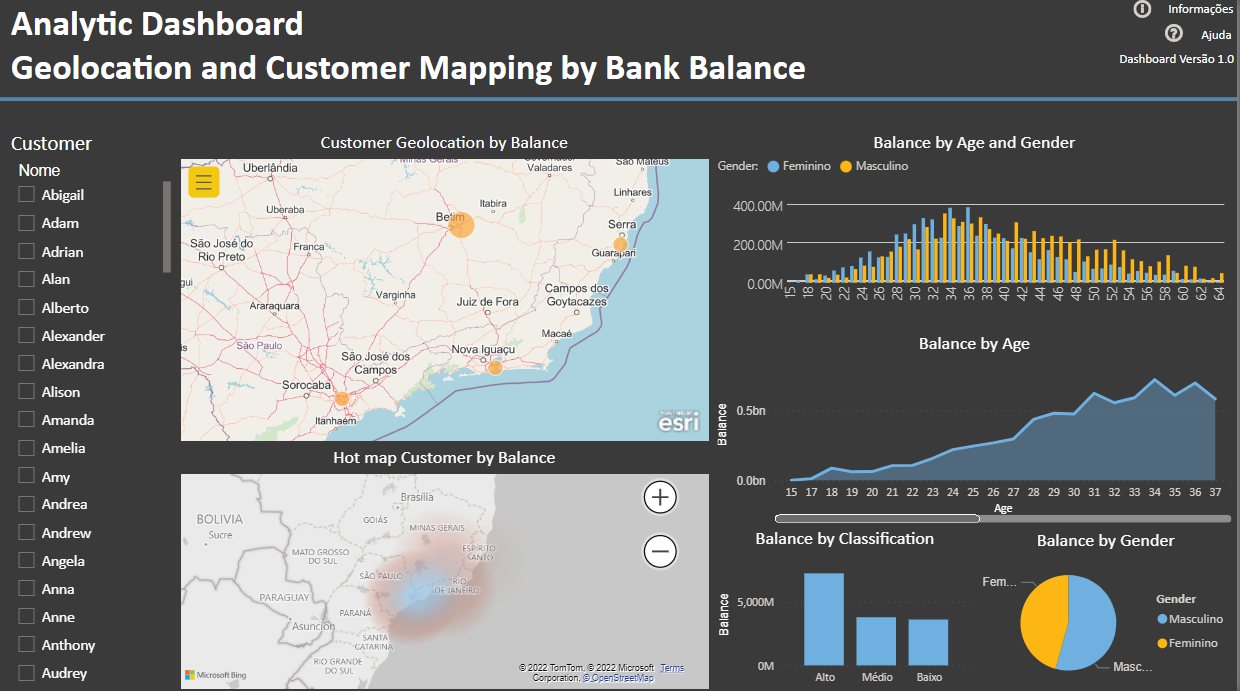
Geolocation and Mapping customers by Bank Balance
Click on the dashboard and see details on Power BI Service tool!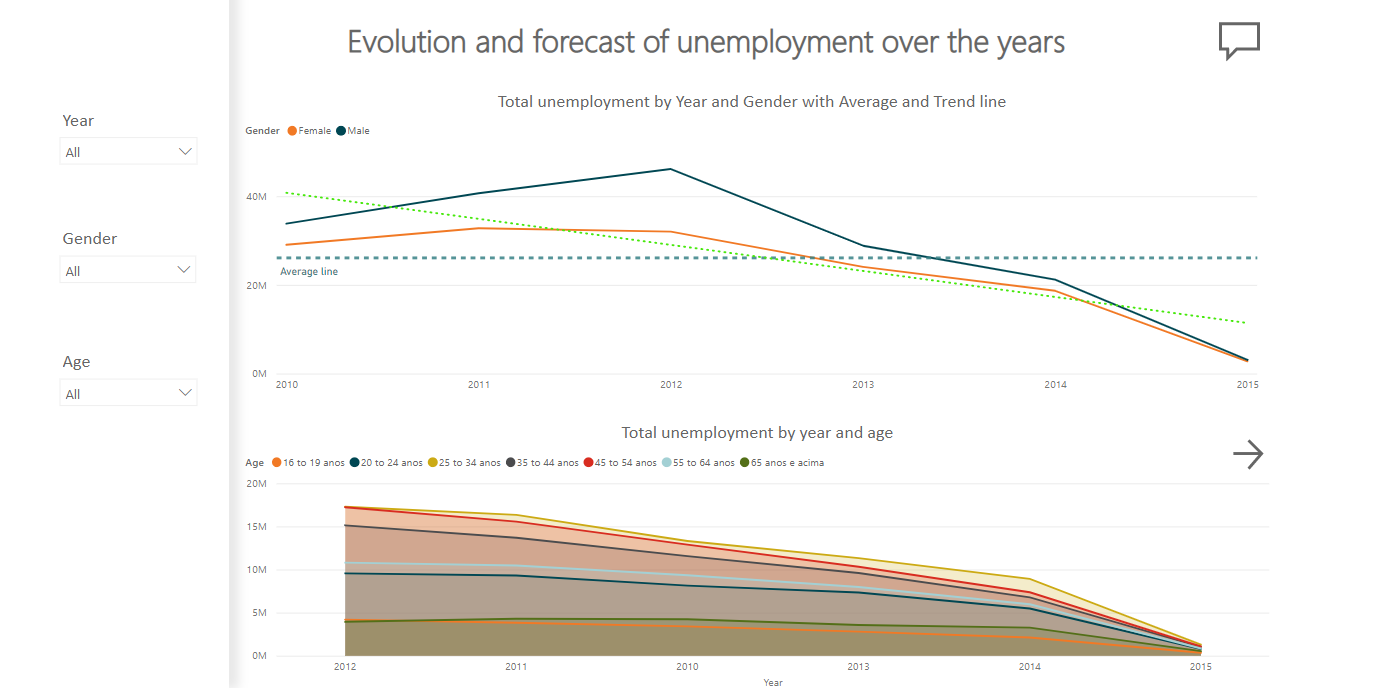
Analytics and AI Report
Evolution and forecast of unemployment over time. Click on the dashboard and see details on Power BI Service tool!About Me
I have been working as an IT professional for 16 years having experience in software factory and commercial, pharmaceutical, financial, and telecommunications companies. I worked on various stages of a research project, from the assessment of client needs and functional specifications to the analysis, development, and testing of windows, web-based applications and products using mainly Microsoft technologies. For more than 3 years I've been passionate about finding out what the data says!